Difference between revisions of "Mark statistics - DatLab"
From Bioblast
Beno Marija (talk | contribs) |
|||
| Line 14: | Line 14: | ||
:::# '''Plot for marks''': Select the source plot on which the relevant Marks are set. | :::# '''Plot for marks''': Select the source plot on which the relevant Marks are set. | ||
:::# '''Channel selection''': [[O2k signals and output|Select channels]] for which plots should be displayed in the mark statistics table. | :::# '''Channel selection''': [[O2k signals and output|Select channels]] for which plots should be displayed in the mark statistics table. | ||
:::# '''Copy to clipboard options''': Select '''All marks in plot''' when a non-standard protocol and non-standard Mark names have been used for data acquisition. If data were recorded using [[MiPNet22. | :::# '''Copy to clipboard options''': Select '''All marks in plot''' when a non-standard protocol and non-standard Mark names have been used for data acquisition. If data were recorded using a [[MiPNet22.16_DatLab_7_Innovations:_DL-Protocols |DatLab protocol]], '''DL-protocol marks''' can be selected along with the desired format for data display. For either selection, the previous chosen data display format can be changed again. | ||
:::# '''Select''' how the displayed values are calculated over the sections defined by marks. Default: [[Median]]; other options: [[Average]], [[Range]], Maximum, Minimum. | :::# '''Select''' how the displayed values are calculated over the sections defined by marks. Default: [[Median]]; other options: [[Average]], [[Range]], Maximum, Minimum. | ||
:::# '''Sort by''': Select the sequence of marks, sorted according to a time sequence (Time) or in alphanumerical order (Mark name). Values are displayed for all selected plots. The source plot for marks is indicated by an "X". | :::# '''Sort by''': Select the sequence of marks, sorted according to a time sequence (Time) or in alphanumerical order (Mark name). Values are displayed for all selected plots. The source plot for marks is indicated by an "X". | ||
Revision as of 06:16, 13 July 2018
Description
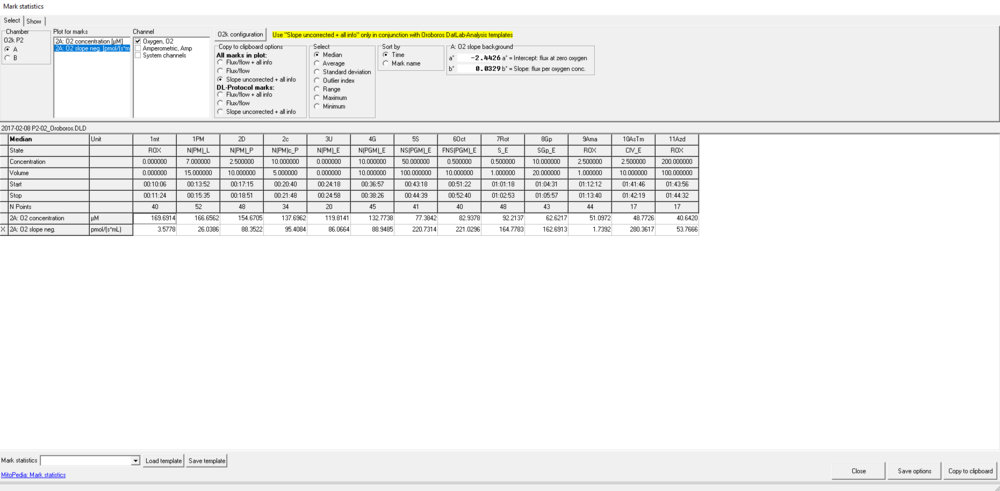
In Mark statistics one Plot is selected as a source for Marks over sections of time. Values (e.g. medians) are displayed for these time sections of the source plot and of all selected plots.
Abbreviation: F2
Reference: MitoPedia:_DatLab
MitoPedia O2k and high-resolution respirometry:
DatLab
Contributed by Krumschnabel Gerhard, modified after Gnaiger Erich and Plattner Christina 2016-03-09, last update 2018-03-20.
Action
- Set the Marks in DatLab on a selected (active) Plot.
- Go to the menu [Marks] and select in which format the Marks shall be displayed: [Flux/flow + all info], [Flux/flow], or [Slope uncorrected + all info] (default selection). A table is shown with all marks and their values.
- Select the O2k-chamber (A or B) for which plots should be displayed.
- Plot for marks: Select the source plot on which the relevant Marks are set.
- Channel selection: Select channels for which plots should be displayed in the mark statistics table.
- Copy to clipboard options: Select All marks in plot when a non-standard protocol and non-standard Mark names have been used for data acquisition. If data were recorded using a DatLab protocol, DL-protocol marks can be selected along with the desired format for data display. For either selection, the previous chosen data display format can be changed again.
- Select how the displayed values are calculated over the sections defined by marks. Default: Median; other options: Average, Range, Maximum, Minimum.
- Sort by: Select the sequence of marks, sorted according to a time sequence (Time) or in alphanumerical order (Mark name). Values are displayed for all selected plots. The source plot for marks is indicated by an "X".
- Copy to clipboard to copy the table with or without 'Experimental details' to another programme/file (DatLab-Analysis templates). Open the target file (DatLab-Analysis templates and paste [Ctr-V] into the yellow cell for the subsample as indicated.

