Difference between revisions of "Mark statistics - DatLab"
From Bioblast
| Line 1: | Line 1: | ||
{{MitoPedia | {{MitoPedia | ||
|abbr=F2 | |abbr=F2 | ||
|description=In '''Mark statistics''' one | |description=In '''Mark statistics''' one [[Plot in DatLab |Plot]] is selected as a source for [[Marks in DatLab|Marks]] over sections of time. Values (e.g. medians) are displayed for these time sections of the source plot and of all selected plots. | ||
|info=[[MiPNet19.18C_DatLab_Guide]] | |info=[[MiPNet19.18C_DatLab_Guide]] | ||
}} | }} | ||
{{MitoPedia O2k and high-resolution respirometry | {{MitoPedia O2k and high-resolution respirometry | ||
|mitopedia O2k and high-resolution respirometry=DatLab | |mitopedia O2k and high-resolution respirometry=DatLab | ||
}} | }} | ||
== Action == | == Action == | ||
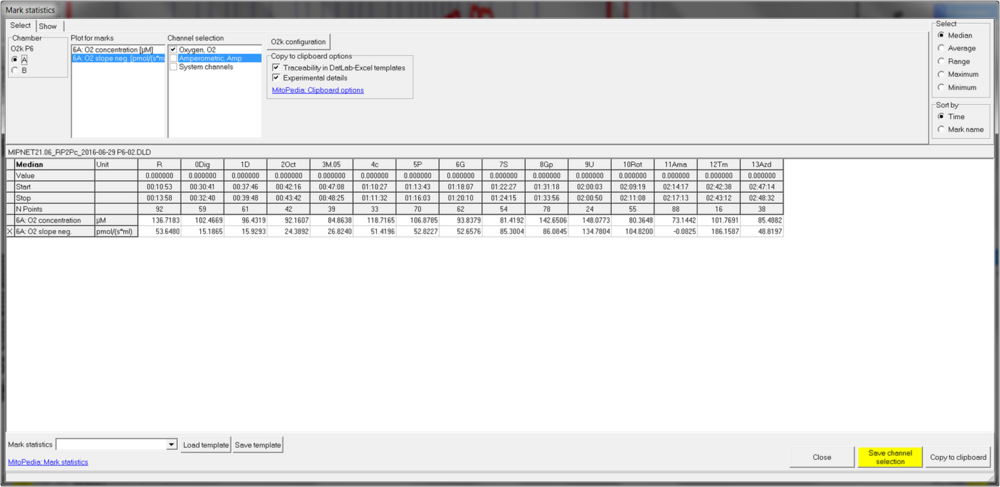
:::# Select the O2k-chamber (A or B) for | :::# Set the [[Marks in DatLab]] on a selected (active) [[Plot in DatLab |Plot]]. | ||
:::# Select the source plot on which the | :::# Go to the menue '''[Marks]/[Statistics]'''. A table is shown with all marks and their values. | ||
:::# | :::# '''Select''' the O2k-chamber (A or B) for which plots should be displayed. | ||
:::# Select how the displayed values are calculated | :::# '''Plot for marks''': Select the source plot on which the relevant Marks are set. | ||
:::# Select the sequence of marks, sorted according to a time sequence (Time) or in alphanumerical order (Mark name). | :::# '''Channel selection''': Select channels for which plots should be displayed in the mark statistics table. | ||
:::# '''Copy to clipboard options''': Select/deselect »[[Traceability in DatLab-Excel templates]]''<sup>a</sup>'' and »[[Experimental details]]''<sup>a</sup>'' (''see footnotes a and b for a summary''). | |||
:::# '''Select''' how the displayed values are calculated over the sections defined by marks. Default: [[Median]]; other options: [[Average]], [[Range]], Maximum, Minimum. | |||
:::# '''Sort by''': Select the sequence of marks, sorted according to a time sequence (Time) or in alphanumerical order (Mark name). Values are displayed for all selected plots. The source plot for marks is indicated by an "X". | |||
:::# '''[[Copy to clipboard]]''' to copy the table with or without [[Experimental details]] to another programme/file ([[Excel-DatLab templates]]). Open the target file ([[Excel-DatLab templates]] and paste [Ctr-V] into the yellow cell for the subsample as indicated. | |||
:::: | ::::* Footnote a: '''[[Traceability in DatLab-Excel templates]]''' is selected when copying Mark statistics from DatLab to DatLab-Excel templates for DatLab 7. The uncorrected negative slope of the calibrated oxygen concentration over time (O2 slope neg.) is shown in the Mark statistics table and copied to clipboard, together with 'Experimental details'. All corrections and normalization is performed in the DatLab-Excel templates, for traceability and quality control of the analysis. To copy the current values (e.g. flux per mass), the tick box '''Traceability in DatLab-Excel templates''' is deselected, when using older versions of DatLab-Excel templates or other programmes (e.g. SigmaPlot). It is important to carefully evaluate which set of data rows is relevant. | ||
::::* Footnote b: '''Experimental details''' are copied to clipboard as default in DatLab 7, preceeding the table as shown in the Mark statistics window. This option is to be chosen for the new [[DatLab-Excel templates]]. In order to use older versions of DatLab-Excel templates, this function is switched off by deselecting the tick box 'Experimental details'. | |||
[[File:Mark statistics.png|left|1000px|link=MiPNet19.18E O2 Flux Analysis|Mark statistics in DatLab 7]] | |||
Revision as of 10:54, 24 July 2016

- high-resolution terminology - matching measurements at high-resolution
Mark statistics - DatLab
Description
In Mark statistics one Plot is selected as a source for Marks over sections of time. Values (e.g. medians) are displayed for these time sections of the source plot and of all selected plots.
Abbreviation: F2
Reference: MiPNet19.18C_DatLab_Guide
MitoPedia O2k and high-resolution respirometry:
DatLab
Action
- Set the Marks in DatLab on a selected (active) Plot.
- Go to the menue [Marks]/[Statistics]. A table is shown with all marks and their values.
- Select the O2k-chamber (A or B) for which plots should be displayed.
- Plot for marks: Select the source plot on which the relevant Marks are set.
- Channel selection: Select channels for which plots should be displayed in the mark statistics table.
- Copy to clipboard options: Select/deselect »Traceability in DatLab-Excel templatesa and »Experimental detailsa (see footnotes a and b for a summary).
- Select how the displayed values are calculated over the sections defined by marks. Default: Median; other options: Average, Range, Maximum, Minimum.
- Sort by: Select the sequence of marks, sorted according to a time sequence (Time) or in alphanumerical order (Mark name). Values are displayed for all selected plots. The source plot for marks is indicated by an "X".
- Copy to clipboard to copy the table with or without Experimental details to another programme/file (Excel-DatLab templates). Open the target file (Excel-DatLab templates and paste [Ctr-V] into the yellow cell for the subsample as indicated.
- Footnote a: Traceability in DatLab-Excel templates is selected when copying Mark statistics from DatLab to DatLab-Excel templates for DatLab 7. The uncorrected negative slope of the calibrated oxygen concentration over time (O2 slope neg.) is shown in the Mark statistics table and copied to clipboard, together with 'Experimental details'. All corrections and normalization is performed in the DatLab-Excel templates, for traceability and quality control of the analysis. To copy the current values (e.g. flux per mass), the tick box Traceability in DatLab-Excel templates is deselected, when using older versions of DatLab-Excel templates or other programmes (e.g. SigmaPlot). It is important to carefully evaluate which set of data rows is relevant.
- Footnote b: Experimental details are copied to clipboard as default in DatLab 7, preceeding the table as shown in the Mark statistics window. This option is to be chosen for the new DatLab-Excel templates. In order to use older versions of DatLab-Excel templates, this function is switched off by deselecting the tick box 'Experimental details'.