File:MiPNet06.06 Fig1.jpg
From Bioblast
Revision as of 14:45, 29 November 2013 by Bidaurratzaga Eider (talk | contribs) (Fig. 1. Continuous records of chemical background flux with 0.5 mM TMPD, 2 mM ascorbate, and various cytochrome c concentrations (μM, indicated as numbers at each curve), plotted as a function of oxygen concentration. Measured at 30 °C in mitochondrial )
MiPNet06.06_Fig1.jpg (490 × 475 pixels, file size: 33 KB, MIME type: image/jpeg)
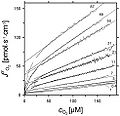
Fig. 1. Continuous records of chemical background flux with 0.5 mM TMPD, 2 mM ascorbate, and various cytochrome c concentrations (μM, indicated as numbers at each curve), plotted as a function of oxygen concentration. Measured at 30 °C in mitochondrial medium R05 with 280 IU/ml catalase. The linear sections of the curves were used for background corrections at high oxygen >50 μM.
File history
Click on a date/time to view the file as it appeared at that time.
| Date/Time | Thumbnail | Dimensions | User | Comment | |
|---|---|---|---|---|---|
| current | 14:45, 29 November 2013 |  | 490 × 475 (33 KB) | Bidaurratzaga Eider (talk | contribs) | Fig. 1. Continuous records of chemical background flux with 0.5 mM TMPD, 2 mM ascorbate, and various cytochrome c concentrations (μM, indicated as numbers at each curve), plotted as a function of oxygen concentration. Measured at 30 °C in mitochondrial |
You cannot overwrite this file.
File usage
There are no pages that use this file.
